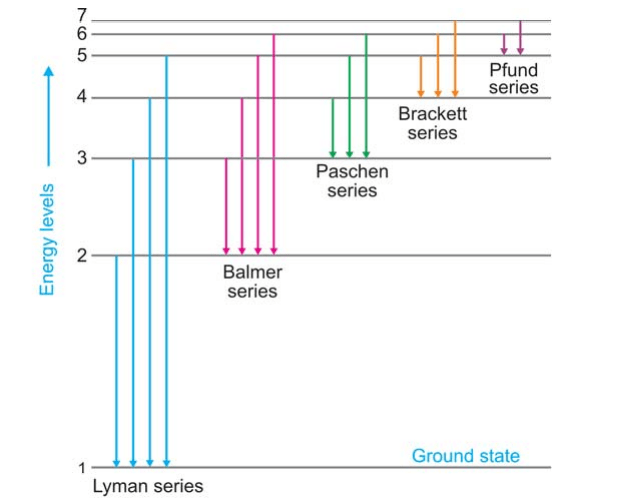
Bohr’s Explanation of Hydrogen Spectrum: At room temperature, the single electron in a hydrogen atom sits in the first orbit (n = 1) and is at the lowest energy state (ground state). When energy is given to hydrogen gas in the discharge tube, the electron travels to higher energy levels, such as 2, 3, 4, 5, 6, 7, and so on, depending on how much energy is absorbed. The electron recovers from these high energy levels by jumping to a lower energy level. As a result, the electron emits surplus energy in the form of a photon. This is a fantastic description of the many hydrogen spectral series.
When an electron returns to the ground state, n = 1, from higher energy levels (n2 = 2, 3, 4, 5, etc.), the Lyman series is formed. When the electron returns to the second, third, fourth, and fifth energy levels, the Balmer, Paschen, Brackett, and Pfund series are formed, as illustrated in Figure.
| Series | n1 | n2 | Region | Wavelength λ (Å) |
| Lyman | 1 | 2, 3, 4, 5, etc. | ultraviolet | 920-1200 |
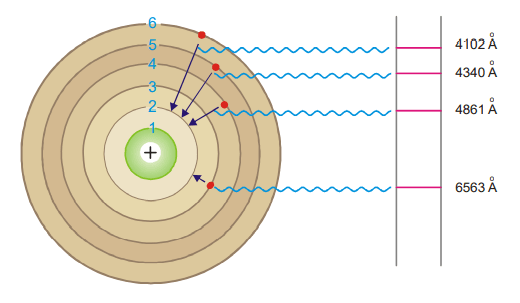
| Balmer | 2 | 3, 4, 5, 6, etc. | visible | 4000-6500 |
| Paschen | 3 | 4, 5, 6, 7, etc. | infrared | 9500-18750 |
| Brackett | 4 | 5, 6, 7 | infrared | 19450-40500 |
| Pfund | 5 | 6, 7 | infrared | 37800-75000 |
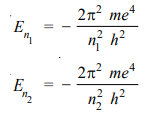
The value of Rydberg’s constant is the same as in the original empirical Balmer’s equation According to equation (1), the energy of the electron in orbit n1 (lower) and n2 (higher) is
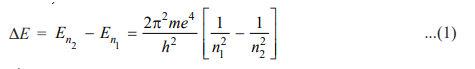
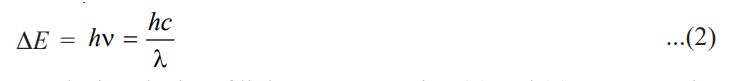
where λ is the wavelength of photon and c is the velocity of light. From equations (1) and (2), we can write
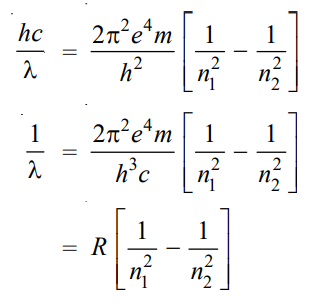
where R is Rydberg constant. The value of R can be calculated as the value of e, m, h, and c are known. It comes out to be 109,679 cm-1 and agrees closely with the value of the Rydberg constant in the original empirical Balmer’s equation (109,677 cm-1).
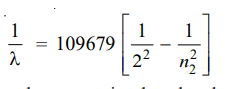
Calculation of wavelengths of the spectral lines of Hydrogen in the visible region
These lines constitute the Balmer series when n1 = 2. Now the equation (3) above can be written as
Shortcomings of the bohr atom
- The Bohr theory’s greatest achievement was its ability to anticipate lines in the hydrogen atom spectrum. However, it was a resounding failure for every other atom with more than one electron.
- We no longer believe in well-defined electron orbits as was assumed by Bohr. In fact, in view of modern advances, like the dual nature of matter, uncertainty principle, any mechanical model of the atom stands rejected.
- The capacity of atoms to form molecules through chemical bonding was not accounted for in Bohr’s electrical structure model. We only accept Bohr’s ideas on quantization today because no one has been able to explain atomic spectra without numerical quantization, and no one has attempted to describe atoms using classical physics.
- Bohr’s theory could not explain the effect of magnetic field (Zeeman effect) and electric field (Stark effect) on the spectra of atoms.