Table of Contents
What is the range?
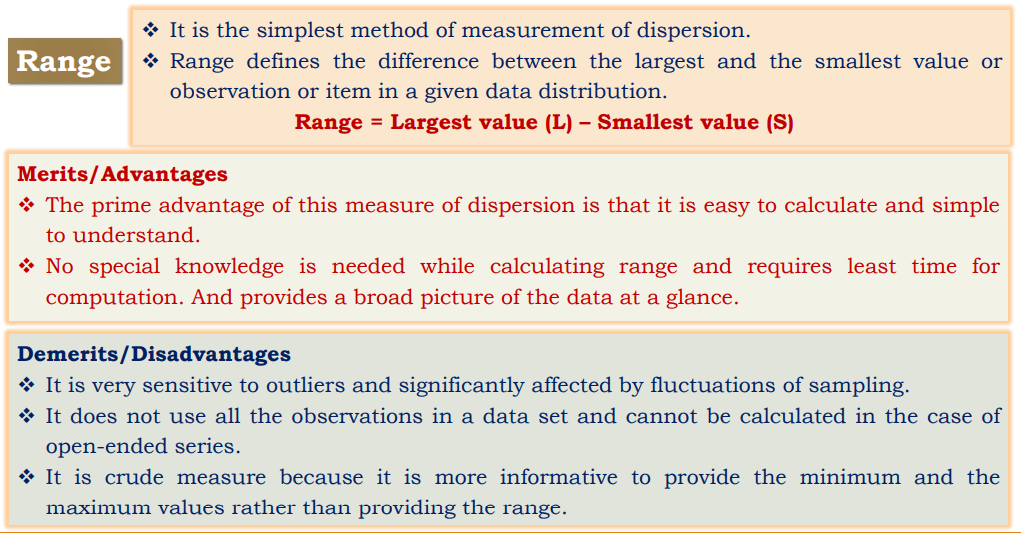
Range in statistics: It is the simplest method of measurement of dispersion. Range defines the difference between the largest and the smallest value or observation or item in a given data distribution.
Range = Largest value (L) – Smallest value (S)
Merits/Advantages
- The prime advantage of this measure of dispersion is that it is easy to calculate and simple to understand.
- No special knowledge is needed while calculating range and requires the least time for computation. And provides a broad picture of the data at a glance.
Demerits/Disadvantages
- It is very sensitive to outliers and significantly affected by fluctuations of sampling.
- It does not use all the observations in a data set and cannot be calculated in the case of open-ended series.
- It is crude measure because it is more informative to provide the minimum and the maximum values rather than providing the range.
Quartile and Interquartile Range (IQR)
Quartile range in statistics
- Quartiles defined as the spread of a data set by breaking the data set into quarters. For example Upper Quartile ( Q75 or Q3) ; Middle Quartile (Q50 or Q2) ; Lower Quartile (Q25 or Q1)
- Quartiles are a useful measure of spread because they are much less affected by outliers or a skewed data set than the equivalent measures of mean and standard deviation.
- Quartiles are often reported along with the median as the best choice of measure of spreadand central tendency, respectively, when dealing with skewed and/or data with outliers.
- A common way of expressing quartiles is as an interquartile range ( IQR ).
Interquartile range (IQR)
Interquartile Range = Upper Quartile (Q3)–Lower Quartile(Q1)
- Interquartile range is defined as the difference between the 25th and 75th percentile (also called the first and third quartile). Hence the interquartile range describes the middle 50% of observations.
- It is also defined as the difference between the Upper Quartile (Q3) and Lower Quartile (Q1) of a given distribution.
- If the interquartile range is large it means that the middle 50% of observations are spaced wide apart.
- Where a range is a measure of where the beginning and end are in a set, an interquartile range is a measure of where the bulk of the values lie.
Advantages of Interquartile range
The interquartile range can be used as a measure of variability if the extreme values are not being recorded exactly. It is not affected by extreme values.
Disadvantage of Interquartile range
The interquartile range used as a measure of dispersion is that it is not amenable to mathematical manipulation.
Quartile Deviation
- It is known as Semi-Inter-Quartile Range, i.e. half of the difference between the upper quartile and lower quartile.
- The quartiles divide a data set into quarters.
- The first quartile, (Q1) is the middle number between the smallest number and the median of the data.
- The second quartile, (Q2) is the median of the data set.
- The third quartile, (Q3) is the middle number between the median and the largest number.
- Quartile deviation can be calculated by
- Quartile deviation = Q3 (upper quartile) – Q1 (lower Quartile)/2 OR Q = ½ × (Q3 – Q1)
Merits of Quartile Deviation
- It is also quite easy to calculate and simple to understand.
- It is less affected by extreme values so, it a superior to ‘Range’.
- It is more useful when the dispersion of the middle 50% is to be computed or uses half of the data.
- All the drawbacks of Range are overcome by quartile deviation
- The bit Independent of change of origin
- Best measure of dispersion for open-end classification
Demerits of Quartile Deviation
- It is not based on all the observations.
- It is not capable of further algebraic treatment or statistical analysis.
- It is affected considerably by fluctuations of sampling.
- It is not regarded as a very reliable measure of dispersion because it ignores 50% observations.
- Dependent on change of scale