Table of Contents
Measure of dispersion
Measure of dispersion
- In statistics, dispersion (also called variability, scatter, or spread) is the extent to which a data distribution is stretched or squeezed.
- In other words, dispersion is the extent to which values in a distribution differ from the average of the distribution.
- It gives us an idea about the extent to which individual items vary from one another, and from the central value.
- It is the indication of scattering or spreading or variability of the data.
- Common examples of measures of statistical dispersion are
Range and interquartile range
Variance
Standard deviation
Types or Classification of Measures of Dispersion
An absolute measures of dispersion
- The measures which express the scattering of observation in terms of distances i.e., range, quartile deviation.
- The measure which expresses the variations in terms of the average of deviations of observations like mean deviation and standard deviation.
A relative measures of dispersion
- A relative measure of dispersion for comparing distributions of two or more data set and for unit-free comparison.
- They are the coefficient of range, the coefficient of mean deviation, the coefficient of quartile deviation, the coefficient of variation, and the coefficient of standard deviation.
Characteristics of Measure of Dispersion
- It have the same units as the quantity being measured.
- It shows the homogeneity or the heterogeneity of the distributionmof the observations.
- When a data set has a large value, the values in the set are widely scattered; when it is small the items in the set are tightly clustered.
- They are rigidly defined, not affected by extreme values, and not affected by sampling fluctuations.
- Measures of dispersion are type of descriptive statistics that describe how similar a set of scores are to each other.
- The more similar the scores are to each other, the lower the measure of dispersion.
- The less similar the scores are to each other, the higher the measure of dispersion.
Example 1: Find the Standard deviation for the following set of sample data by the direct method.
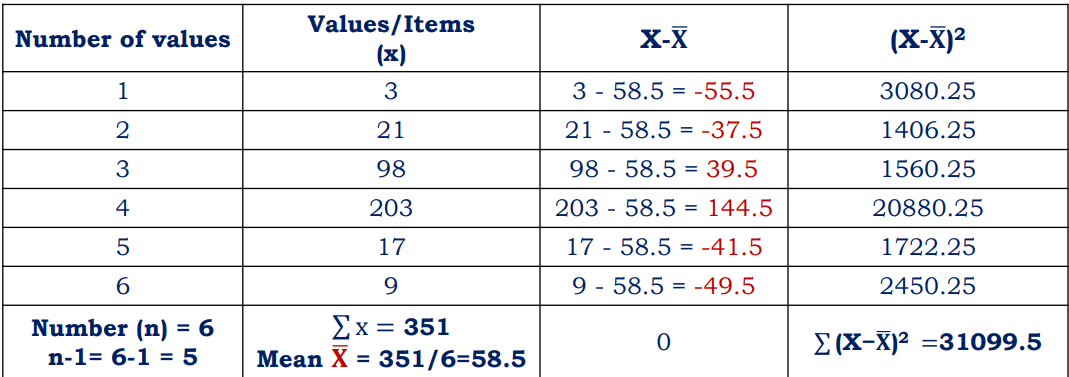
Solution: Substitute the values in the equation and find out SD

Make sure check our amazing article on: Measures of central tendency