In statistics, a central tendency is a central value or a typical value for a probability distribution.
- It is occasionally called an average or just the center location/center of the distribution.
- The most common measures of central tendency are Mean, Median and Mode
- Measures of central tendency are defined for
- A Population (large set of observations of a similar nature)
- A Sample (portion of the observations of a population)
Table of Contents
Definitions of Measure of central tendency
- Simpson and Kafka defined “ A measure of central tendency is a typical value around which other figures gather”.
- Waugh has expressed “An average stand for the whole group of which it forms a part yet represents the whole”.
- In layman’s term, a measure of central tendency is an AVERAGE. It is a single number of value which can be considered typical in a set of data as a whole.
Importance of Measure central tendency
- To find representative value.
- To make more concise data.
- To make comparisons.
- Helpful in further statistical analysis
Population in statistics – Raw Data
Large set of observations/values/facts/elements/objects of a similar nature
The population number is represented by N
Examples
- The number of students studying in V.L.College of Pharmacy.
- Number of Boys studying in V.L.College of Pharmacy.
- Number of Girls studying V.L.College of Pharmacy.
- Weight of Boys studying in V.L.College of Pharmacy.
- Weight of Girls studying in V.L.College of Pharmacy.
- Height of Boys studying in V.L.College of Pharmacy.
- Height of Girls studying in V.L.College of Pharmacy.
Sample in statistics – Sample Data
Small set/Section/Fraction of observations/values/facts/elements/objects of a Population.
The sample number is represented by n
Examples
- The random number of Boys studying in V.L.C.P.
- The random number of Girls studying in V.L.C.P.
- Random Weight of Boys studying in V.L.C.P.
- Random Weight of Girls studying in V.L.C.P.
What is mean in statistics
- The Mean is the most commonly used measure of central tendency.
- The mean is usually the average of the total observations or values in population as well as sample data.
- The Mean is obtained by computing the sum, or total, for the entire set of observations or values, then dividing this by sum of the number of observations or values.
- The mean is sensitive to every observations or values because discarding or adding one observations or values the mean will changes.
- If a constant value is added to every score in a distribution, then the same constant value is added to the mean. Also, if every score is multiplied by a constant value, then the mean is also multiplied by the same constant value.
- The mean should be used when the data were either interval or ratio scaled.
- The mean is impossible to compute when the data were nominal scale, and it is usually inappropriate to compute a mean when data are measured on an ordinal scale.
- The Population mean is represented by the Greek letter – μ.
- The Sample mean is represented by the Greek letter – x.
The mean is calculated by using the equations

Pharmaceutical problems: Calculate the Population Mean and Sample Mean for the following data sets.
Problem 1– Weights in mg of tablets in a sample data are 110, 122, 109, 121, 105 Find out the Sample mean?

X is the summation of the tablet
weight i.e. 110+125+100+120+105
N is the summation of the number of
observations
i.e = 5
110+125+100+120+ 105=160
160/5=32 (Answer- The sample mean for the above problem is 32)
Problem 2: Calculate the mean for the following data on systolic BP of volunteers.

Solution
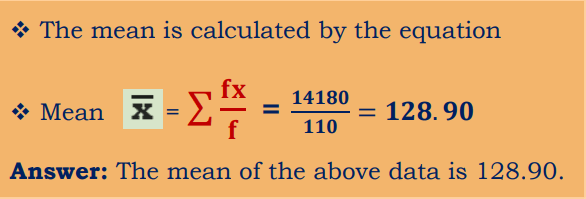
- This data is an example of discrete series data.
- In this data Frequency (f) and Sample size (x) were given.
- In each case multiply f and x
- Summarize fx value.
- Summarize f values

Problem 3: Calculate the mean for the following data on systolic BP of volunteers.

Solution
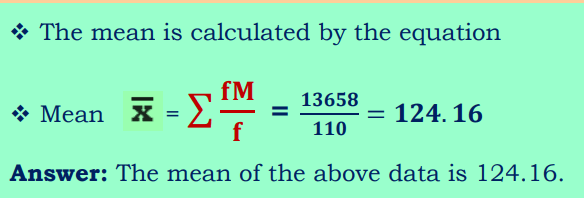
- This data is an example of continuous series data, where the class interval is given.
- Determine the Midpoint of the data and considered it as ( x ).
- Midpoint is determined in each case by adding lower limit and upper limit divided by 2.
- In each case multiply f and x
- Summarize fx value.
- Summarize f values

What is the median in statistics
- Median is one of the important measure of central tendency.
- Median is the middle value or mid point of the given data, when data arranged in an order viz., smallest to larger or ascending order.
- Median is simply another name for the 50th percentile and divides the data so that 50% of the values in the data are equal to or less than the median.
- Median are measured on an ordinal, interval, or ratio scale.
- Median is relatively unaffected by extreme scores.
- The median is often used when the distribution of data is either positively or negatively skewed.
- Median tends to stay in the “center” of the distribution even when the distribution is very skewed. In these situations, the median serves as a good alternative to the mean.
- Median can be found by a simple counting procedure:
- With an odd number of scores, list the values in order, and the median is the middle score in the list.
- With an even number of scores, list the values in order, and the median is half-way between the middle two scores.
- If the scores are measurements of a continuous variable, it is possible to find the median by first placing the scores in a frequency distribution histogram with each score represented by a box in the graph.
- Then, draw a vertical line through the distribution so that exactly half the boxes are on each side of the line. The median is defined by the location of the line.
- The Median is represent by the symbol M.
How to calculate the Median
- Arrange the data sets in ascending order (from the lowest to the largest value).
- If the dataset contains an odd number of values, the median is a central value that will split the dataset into halves. For the Odd data series, the equation is

If the dataset contains an even number of values, find the two central values that split the dataset into halves. Then, calculate the mean of the two central values. For Even data series the equation is

What is the Mode in statistics
- The Mode is the least used measure of central tendency.
- The Mode of a data set is the number/observation/value that occurs most frequently in the set.
- To find the Mode, put the numbers in order from least to greatest and count how many times each number occurs. The number that occurs the most is the Mode!
- In a set of data, there may be no Mode if no value appears more than any other. There may be Two Modes (bimodal), Three Modes (trimodal), or Four or more Modes (multimodal).
- The numerical value of the Mode is the same value as that Mean and Median in a normal distribution, and it may be very different in highly skewed distributions and the average value in the data.
- The Mode will be the best measure of central tendency (as it is the only one appropriate to use) when dealing with nominal data.
- The symbol used for Mode Mo
Method of measurement of Mode
Example 1: Find the mode of the given data set: 3, 3, 6, 9, 15, 15, 15, 27, 27, 37, 48.
Solution: 3, 3, 6, 9, 15, 15, 15, 27, 27, 37, 48 is the data set
15 is the mode since it is appearing more times in the set compared to other
numbers.
Example 2: Find the mode of 4, 4, 4, 9, 15, 15, 15, 27, 37, 48 data set.
Solution: 4, 4, 4, 9, 15, 15, 15, 27, 37, 48 is the data set.
As we know, a data set or set of values can have more than one mode if more than one
value occurs with equal frequency and number of times compared to the other values in
the set.
Hence, here both the numbers 4 and 15 are modes of the set.
Example 3: Find the mode of 3, 6, 9, 16, 27, 37, 48.
Solution: If no value or number in a data set appears more than once, then the set
has no mode.
Hence, for sets 3, 6, 9, 16, 27, 37, 48, there is no mode available.
Mode Formula for grouped frequency distribution
In the case of grouped frequency distribution, calculate the modal class. Mode lies inside the modal class. The mode of data is given by the formula:

Where,
l = lower limit of the modal class
h = size of the class interval
f1 = frequency of the modal class
f0 = frequency of the class preceding the modal class
f2 = frequency of the class succeeding the modal class
Let us take an example to understand this clearly.
Example 4: In a class of 30 students marks obtained by students in mathematics out of 50 is tabulated as below. Calculate the mode of data given in table

- Solution:
- The maximum class frequency is 12.
- Class interval corresponding to this frequency is 20 – 30.
- Thus, the modal class is 20 – 30.
- Lower limit of the modal class (l) = 20.
- Size of the class interval (h) = 10.
- Frequency of the modal class ( f1 ) = 12.
- Frequency of the class preceding the modal class (f0) = 5.
- Frequency of the class succeeding the modal class (f2)= 8
- Substituting these values in the formula

