Table of Contents
Standard deviation
- The concept of Standard deviation was introduced by Karl Pearson in 1893.
- In Statistics, Standard deviation is the measure of dispersion of a set of data from itsmean.
- It measures the absolute variability of a distribution or how much your data is spread outaround the mean or average.
- More precisely, Standard deviation is a measure of the average distance between the valuesof the data in the set and the mean.
- A low standard deviation indicates that the data points tend to be very close to the mean
- A high standard deviation indicates that the data points are spread out over a large range of values.
- Mathematically Standard deviation defined as the positive square root of the arithmetic mean of the squares of the deviations of the given values from their arithmetic mean.
- It is also referred to as root mean square deviation or Square root of variance i.e., 𝐒.
- It is denoted by a Greek letter sigma, σ.
Merits of Standard Deviation
- Squaring the deviations overcomes the drawback of ignoring signs in mean deviations
- Suitable for further mathematical treatment
- Least affected by the fluctuation of the observations
- The standard deviation is zero if all the observations are constant
- Independent of change of origin
Demerits of Standard Deviation
- Not easy to calculate
- Difficult to understand for a layman
- Dependent on the change of scale
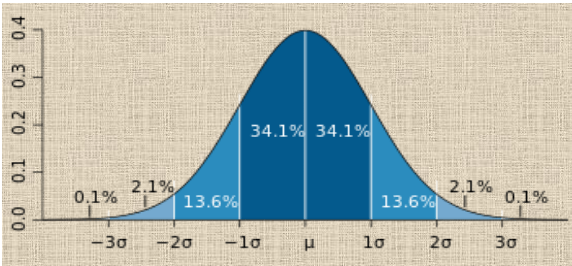
The bell curve (“normal distribution“) is commonly seen in statistics as a tool to understand standard deviation. The mean, or average, is represented by the Greek letter μ, in the center. Each segment (colored in dark blue to light blue) represents one standard deviation away from the mean. For example, 2σ means two standard deviations from the mean.
Measurement of Standard deviation
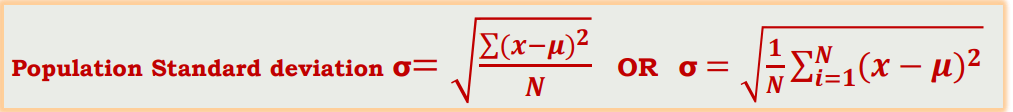
σ = Population standard deviation; ∑ = Sum of…; X = Each value;
μ = Population mean; N = Number of values in the population
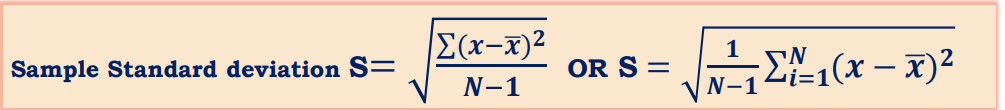
N-1 instead of N (which is called “Bessel’s correction”)
S = Sample standard deviation; ∑ = Sum of…; X = Each value;
𝑥ҧ= Sample mean; N = Number of values in the sample
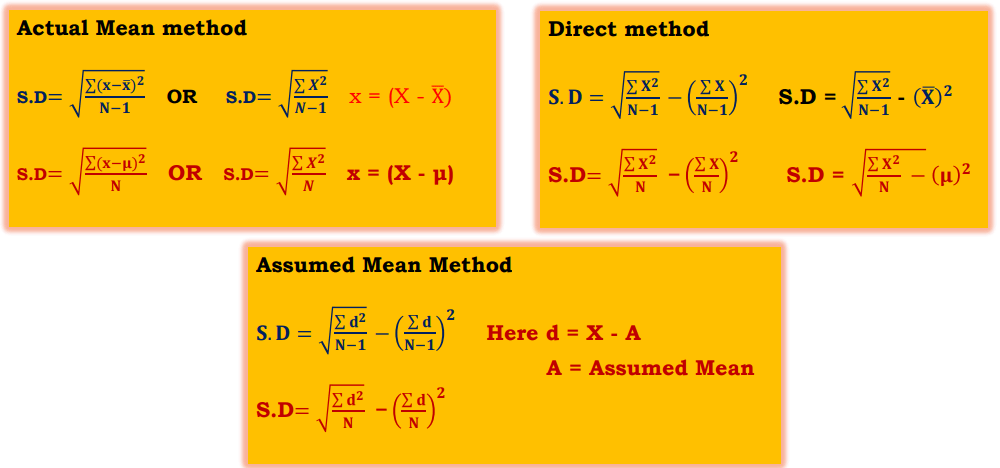
Measurement of Standard deviation- For Individual Series
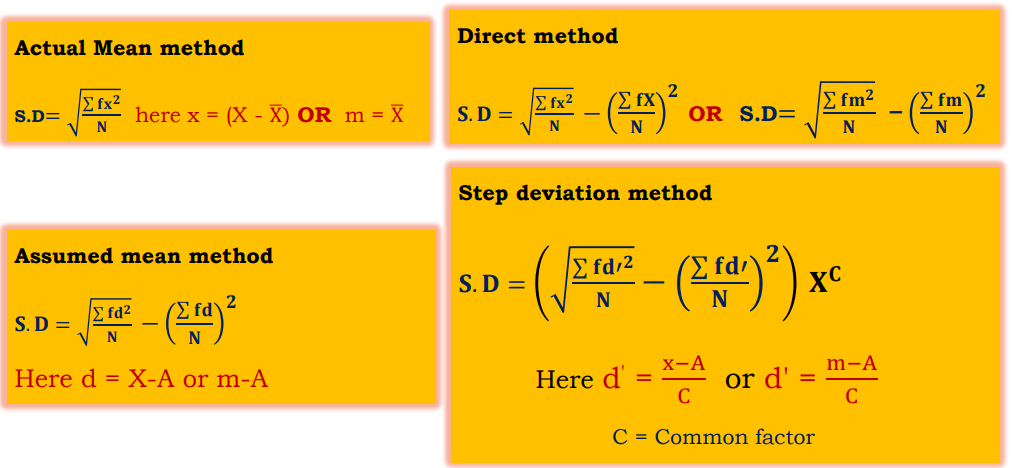
Measurement of Standard deviation- For Discrete and Continuous Series
Make sure check our amazing article on: Variance in statistics