What is Variance
- Variance is one of the important measure of dispersion. it is also called a measure of spread of data from mean.
- According to Layman, it is a measure of how far a set of data (numbers) are spread out from their mean (average) value.
- The more the value of variances, the data is more scattered from its mean and if the value of variances is low or minimum, then it is less scattered from mean.
- In other way
- The larger the variances is, the more the scores deviate, on average, away from the mean
- The smaller the variances is, the less the scores deviate, on average, from the mean
- It is mathematically defined as the average of the squared differences from the mean.
- The sample variances is denoted as S2 for Population variances and S for Sample variances, is used to calculate how varied a sample.
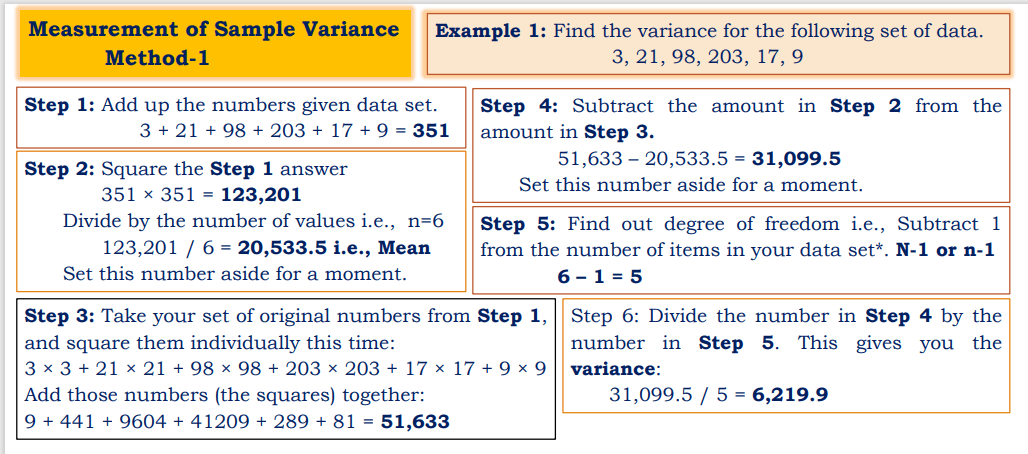
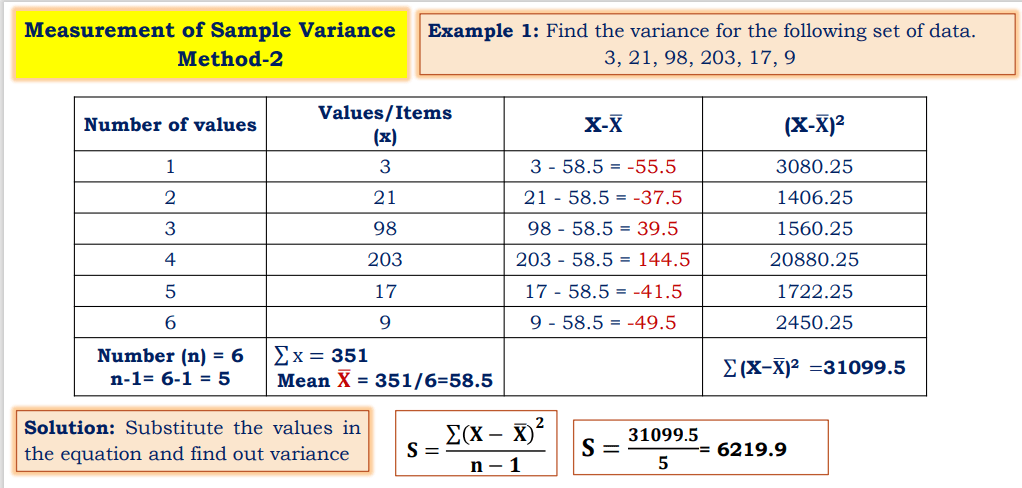
The variances is calculated by:
- Finding the mean (the average).
- Subtracting the mean from each number in the data set and then squaring the result.
- The results are squared to make the negatives and positive, otherwise negative numbers would cancel out the positives in the next step.
- It’s the distance from the mean that’s important, not positive or negative numbers.
- Averaging the squared differences.
- Substitute the values in the following equations to find out variances
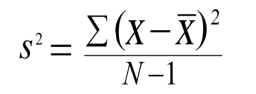
S2 is Population Variances
N-1 Degree of freedom
Make sure check our amazing article on: What is the range in statistics