Table of Contents
The electromagnetic spectrum
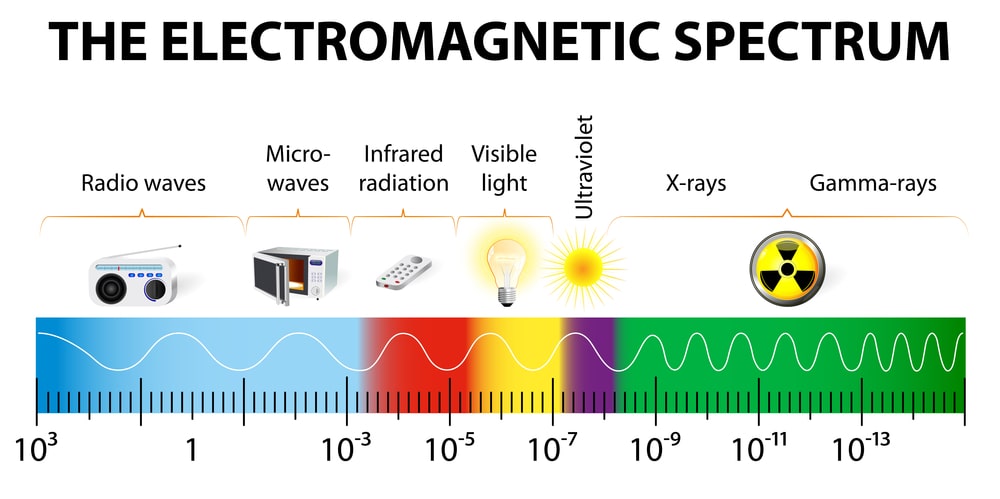
The Electromagnetic radiation spectrum, or simply the Electromagnetic spectrum, is made up of a variety of wavelengths emitted by electromagnetic radiation. The electromagnetic spectrum with wavelengths denoted is seen in the diagram below.
Continuous spectrum in chemistry
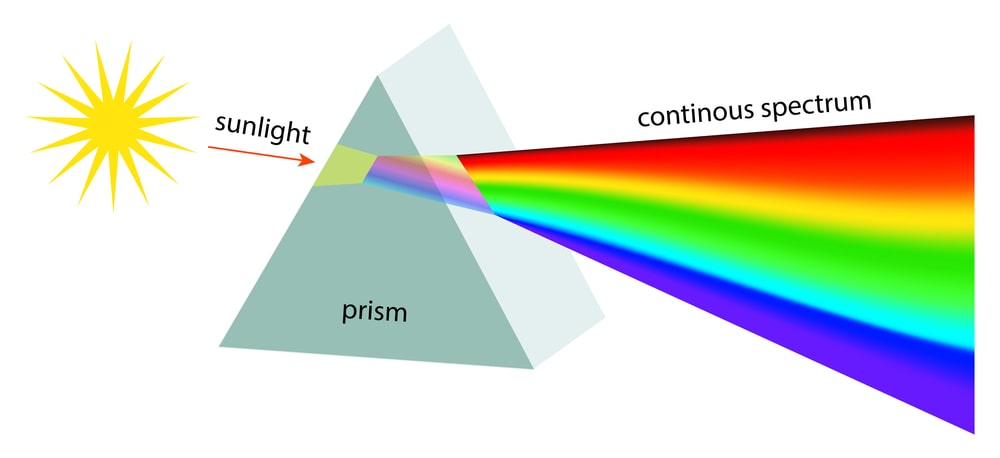
White light is radiant energy coming from the sun or from incandescent lamps. It is composed of light waves in the range 4000-8000 Å. Each wave has a characteristic colour. When a beam of white light is passed through a prism, different wavelengths are refracted (or bent) through different angles. When received on a screen, these form a continuous series of colour bands: violet, indigo, blue, green, yellow, orange and red (VIBGYOR). This series of bands that form a continuous rainbow of colours, is called a Continuous Spectrum.
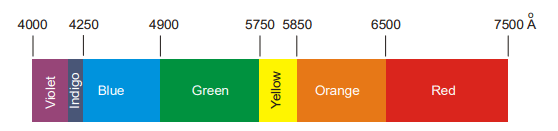
The violet component of the spectrum has shorter wavelengths (4000 – 4250 Å) and higher frequencies. The red component has longer wavelengths (6500 – 7500 Å) and lower frequencies. The invisible region beyond the violet is called the ultraviolet region and the one below the red is called an infrared region.
Atomic spectra in chemistry
The atoms in a vapour or gaseous state are stimulated (energised) and produce light radiations of a certain colour when heated in a flame or discharge tube. The wavelength of the radiation released is indicated by the colour of the light generated.
For example, a Bunsen burner flame is coloured yellow by sodium salts, red by strontium and violet by potassium. In a discharge tube, neon glows orange-red, helium-pink, and so on. If we examine the emitted light with a Spectroscope (a device in which a beam of light is passed through a prism and received on a photograph), the spectrum obtained on the photographic plate is found to consist of bright lines. Such a spectrum in which each line represents a specific wavelength of radiation emitted by the atoms is referred to as the Line spectrum or Atomic Emission spectrum of the element.
Certain wavelengths may be absorbed when white light with all visible wavelengths is transmitted through the cold vapour of an element. As a result, the transmitted light lacks these absorbed wavelengths. The resulting spectrum, known as the Atomic Absorption spectrum or simply Absorption spectrum, is made up of a succession of dark lines. The wavelengths of the dark lines in the emission spectrum are identical to those of the brilliant lines. The absorption spectrum of an element is the polar opposite of its emission spectrum.
Not only in the visible area of the electromagnetic spectrum but also in the infrared (IR spectra) and ultraviolet regions, atomic spectral lines are emitted or absorbed (UV spectra).
Each element has its own distinctive spectrum because atomic spectra are created by energy emission or absorption based on the internal structure of the atom. Spectral analysis has evolved into a strong tool for detecting components even when they are present in minute levels. The discovery of spectral lines of hydrogen and other elements had the most significant impact on our understanding of atomic structure.
Make sure check our amazing article on: Quantum theory and Bohr atom model