Biostatistics and research methodology question bank for B pharmacy 8 semester, this QB released by rguhs Bangalore, it contains all the important questions of the syllabus.
Long Essays 10 Marks questions for Biostatistics and research methodology
- Explain the measures of central tendency
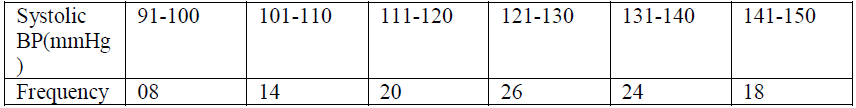
Calculate the mean and standard deviation for the following data on systolic BP of volunteers –
- Explain different types of hypothesis. Explain type I and type II errors, level of significance, P value
- .Explain the different phases of clinical trials.
- Discuss the protocol for an experimental study design.
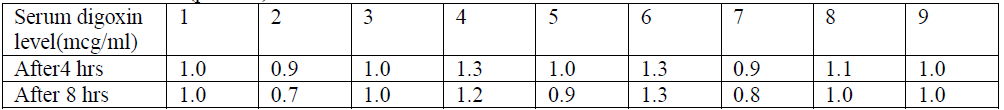
- Explain ‘t’ test. Find if there is statistical significance in the serum digoxin level in the given data:- Critical value= 2.31(p< 0.05)
- What are measures of dispersion? Explain their significance with suitable examples.
- Explain the various phases of clinical trials.
- Explain regression analysis and its applications in stability testing of pharmaceuticals.
- Explain the measures of dispersion. Calculate mean, variance and standard deviation for the given data:-

- Describe the different measures of central tendency. Calculate mean and standard deviation for the given data on mid arm circumference(cm) of 16 children –
14, 12, 13, 10, 11, 13, 14, 12, 12, 11, 10, 13, 12, 11, 10, 14 - Explain types of observational study designs.
- Explain with suitable examples regression analysis and standard error of regression.
- Explain null and alternate hypothesis, type I and type II errors, confidence interval.
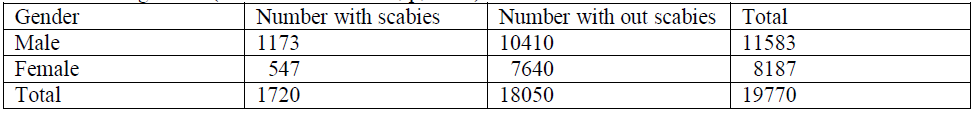
- Explain chi square test. From the following data, test whether prevalence of scabies is significant in two different genders ( critical value=10.83, p,0.001) :-
- What is hypothesis? What are different types of hypothesis? Explain how you will formulate a hypothesis with a suitable example
- What is QbD, Why are DOE essential in a QbD development process?
- What are the measures variability? What is their statistical significance
- Discuss different types of observational clinical studies in detail.
- Discuss various steps involved in testing the significance of single mean and difference between two means (independent samples) in small samples using Student’s t- test.
- Classify different types of data, explain any three measures of dispersion with example.
- Describe briefly the different interventional study designs
- Explain the hypothesis testing of non-parametric data
- Describe the various types of measures of dispersion and their significance.
- Discuss briefly about determination of sample size for simple comparative experiments and for confidence interval of specific width.
- Explain the hypothesis testing of non-parametric data
- How is QbD based product development better. Explain the steps in involved in it.
- How will you design a clinical study methodologically? Explain briefly.
- What is hypothesis? What are different types of hypothesis? Explain how you formulate the hypothesis with a suitable illustration.
- Discuss about the hypothesis testing of parametric data.
Short Essays 5 marks questions for Biostatistics and research methodology
- Explain types of correlation and correlation coefficient. Give suitable examples.
- Define probability and explain its significance in statistical inference with examples.
- What are measures of dispersion? Explain.
- Explain ANOVA and its applications.
- Discuss different methods of sampling.
- Explain the graphical methods of representing quantitative data.
- Discuss the applications of EXCEL and SPSS programmes in statistical analysis.
- What are non-parametric tests? Explain chi square test-Goodness of fit test.
- Explain the types and advantages of factorial design in formulation development.
- Explain correlation, types of correlation and its applications.
- Explain null hypothesis, type I and type II errors.
- Discuss with examples measures of central tendency.
- Discuss the sampling methods in research study.
- Explain probability and its significance in statistical analysis.
- Explain regression analysis to assess the influence of independent variable on continuous variable.
- Explain the hypothesis testing using one way of ANOVA.
- Describe the various of graphical methods of representing quantitative data.
- Explain a typical experimental study design.
- Define and explain correlation with examples.
- Explain student‘t’ test and its applications.
- Explain types of observational study designs.
- Explain ANOVA and its significance.
- Discuss null hypothesis, type I and type II errors.
- Explain the application of factorial design in pharmaceutical product development.
- Explain with examples- Histogram, Pie chart.
- Describe the sampling techniques in research study.
- Discuss Wilcoxon Rank Sum test and Mann Whitney U test.
- Explain type I and type II errors.
- Discuss the methods of sample size calculation in comparative studies.
- Explain Karl Pearson’s coefficient of correlation with examples.
- Explain chi square test for Goodness of fit.
- Discuss the applications of SPSS and SAS in research study.
- Explain one way ANOVA and the assumptions in one way ANOVA.
- Briefly describe the different distribution patterns of data.
- Discuss- Histogram, Bar diagram.
- Explain phases of clinical trial.
- Define ‘t’ test. Explain the different situations where paired and unpaired ‘t’ tests applied
- Explain the different measures of dispersion of data.
- Explain ANOVA and its applications
- Explain the pharmacokinetic applications of regression analysis.
- Define and explain probability and its significance in statistics.
- Define and explain experimental study designs.
- Discuss the methods of sampling in research study.
- Explain correlation coefficient and types of correlation.
- Discuss the applications of SPSS and MINITAB in data analysis.
- Discuss observational studies.
- Describe variance and standard error of mean with suitable example.
- List the elements that need to be incorporated in a clinical study protocol?
- Explain the concept of DOE
- Describe how Mean is the most appropriate measure of centrality with suitable example?
- Explain linear regression? How is it applied for pharmaceutical sciences.
- Explain the statistics of stability testing of pharmaceutical products
- Explain the concept of design space in QbD
- Discuss the general rules for constructing and labeling a graph? b) Describe the construction of a semi-logarithmic graph with an example?
- How is central tendency measured?
- What are general rules for constructing and labeling a graph? Write a note on semi-logarithmic plot with an example.
- Write notes on randomization and objectives of clinical studies.
- What characteristics of data can be represented by a) Histogram b) Pie chart c) Semi-logarithmic plots
- How will test hypothesis for ordinal data.
- Explain chi square test
- Explain the concept of Fractional factorial Design
- Compare and contrast Nonparametric and Parametric data
- Explain the concept of Central Composite Design
- Explain report writing in research methodology.
- Explain the hypothesis testing of non-parametric data
- Describe variance and standard error of mean with suitable example.
- What are the underlying assumptions of one way ANOVA? Explain under what circumstances ANOVA is the most preferred type of statistical data analysis?
- Discuss the general rules for constructing and labeling a graph? b) Describe the construction of a semi-logarithmic graph with an example?
- Compare and contrast Nonparametric and Parametric data
- What are the underlying assumptions of one way ANOVA? Explain under what circumstances ANOVA is the most preferred type of statistical data analysis?
- Explain Fractional Factorial Design
- Role of QbD in Pharmaceutical Development
- Classify different types of data. Explain any three measures of dispersion with examples.
- Classify and list the tests used for hypothesis testing of parametric data
- Classify and explain different types of t- tests.
- Explain Pearson’s correlation &Spearmann’s correlation.
- Explain Wilcoxan signed rank test and Mann Whitney U test.
- Explain in detail about cross-over and parallel clinical study design.
- Classify types of data. Give an outline of testing hypotheses for different types of data
- What are Mixture Designs? List their applications
- Explain linear regression? How is it applied for pharmaceutical sciences?
- Explain about standard deviation and variance.
- Explain Pearson’s correlation &Spearmann’s correlation.
- List the pharmaceutical applications of Student’s t test.
- List the pharmaceutical applications of Student’s t test.
- Distinguish between parametric and non-parametric tests. For what type of data is Chi Square test performed?
- What is underlying assumptions of one way ANOVA? If these assumptions are not fulfilled which alternative non-parametric test do you suggest?
- What is QbD. List the experimental designs used in QbD
- Explain how computers can be used for patient record database management in hospital pharmacy
Short Answers 2 marks questions for Biostatistics and research methodology
- Multiple regression.
- One tailed and Two tailed tests.
- Pharmaceutical examples for optimization techniques.
- Degrees of freedom.
- Standard error of mean and its significance.
- Two methods of sample size calculation in research study.
- Examples of application of regression models in stability testing.
- Wilcoxon Rank Sum test.
- Normal distribution of data.
- Types of Observational study designs.
- Sample size calculation for confidence interval.
- Power of a study.
- Pharmaceutical examples for data analysis using SPSS.
- Factorial design.
- Degrees of freedom.
- Report writing in research study.
- Assumptions in chi square test.
- Confidence interval.
- Characteristics of Normal distribution data.
- Applications of nonparametric tests.
- chi square test.
- Power of a study.
- Confidence interval
- Probability.
- Applications of SAS
- Standard error of mean
- . Features of normal distribution pattern.
- Optimization techniques
- Report writing in research study.
- When is median more important than mean as a measure of central tendency
- Degrees of freedom.
- 22 and 23 designs.
- Power of a study.
- Probability.
- Applications of student‘t’ test.
- Standard error of mean.
- One tailed and Two tailed tests.
- Applications of non-parametric tests.
- Confidence interval.
- Pharmaceutical examples of optimization techniques.
- Characteristics of normal distribution.
- Standard error of mean.
- Histograms.
- Report writing in research study.
- Wilcoxon Rank Sum test.
- Differentiate between sample and population parameter.
- Power of study.
- Descriptive and interferential statistics.
- Classification of clinical study designs.
- Factorial design.
- Power of study
- Confidence interval
- Define blinding in clinical study.
- Differentiate SD and SEM.
- Difference between nominal and ordinal type of data.
- Define scatter plots.
- p-value
- Mann Whitney U tests.
- Advantages of Design space
- Explain one way analysis of variance.
- Confidence interval
- Classification of clinical study designs
- Power of study.
- Define coefficient of variation.
- Comparison of means between three or more distinct/independent groups which parametric and non-parametric test can be used in inferential statistics?
- Sign test.
- Pearson’s Correlation.
- Standard Error of Mean
- Advantages of Data visualization methods
- Central composite design
- Define bias in clinical study.
- Role of sample size in calculation of confidence interval
- Characteristics of normal distribution
- Advantages and disadvantages Pie charts.
- Explain: Range, Interquartile range and Variance
- Standard Error of Mean
- One tailed and two tailed tests.
- Control Space
- Inclusion & exclusion criteria
- Define histogram
- Define discrete and continuous variables.
- Pie charts.
- Types of correlation.
- What is Control Space
- Difference between ANOVA and student t test.
- What factors qualifies mode to be the best measure of central tendency?
- Define α and β error.
- Degree of freedom.
- Classify observational and experimental studies.
- What is interventional study?
- List the characteristics of observational studies.
- Define coefficient of variation.
- Characteristics of normal distribution.
- Define semi logarithmic plots.
- Application of Post Hoc tests
- Type I and Type II errors in hypothesis testing.
- Design Space
- Degrees of freedom.
- Define surrogate & direct end point.
- Relationship between sample size and power of the study.